DRAWINGS
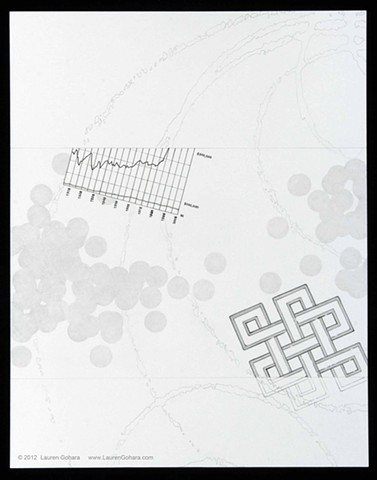
Do You Think You Can Tell #21
Graphite, archival pigmented ink, colored pencil on paper
14 x 11 in
2012
A graph of the average income of the top 1% vs the bottom 99% done in pen and ink lops off the top of the curve. The endless knot tilts off to the right, fading where it crosses the bottom boundary line. Clusters of pale dots drawn in graphite hover between, as the ghostly lines of particle physics tracks curve through the background.