DRAWINGS
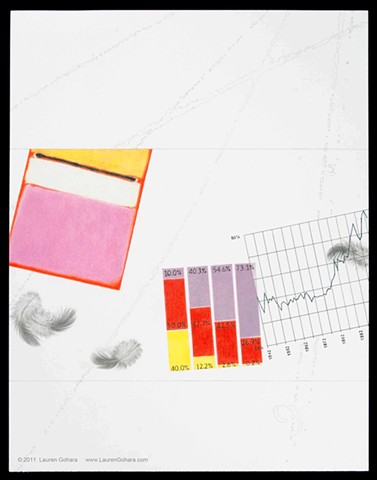
Do You Think You Can Tell #13
Graphite, colored pencil, archival pigmented ink on paper
14 x 11
2011
Echoing the colors of a Rothko, a four-bar chart illustrates the top decile of households' share of pre-tax income, federal tax, and wealth. Next to the chart, a graph marks the change in the top 10%'s share of total income. Pigeon feathers rendered from life lilt alongside, and through the graph. Pale particle physics tracks arc in the background.