DRAWINGS
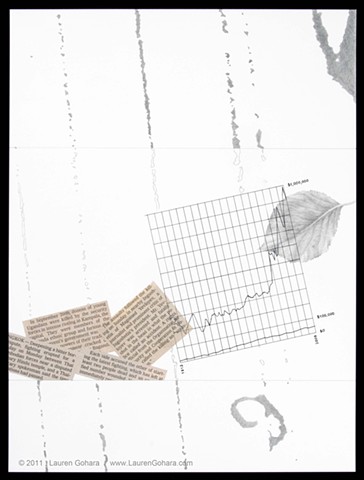
Do You Think You Can Tell #4
Graphite, archival pigmented ink, deacidified newspaper clippings on polypropylene
12 x 9 inches
2011
News clippings of reports of deaths from political violence tumble in at the bottom left. A graph of the average income of the top 1% vs the bottom 99% in pen and ink dominates the middle. A rendering in graphite of a callery pear leaf wafts through off to the right. Ghostly lines of particle physics tracks race through the background.