DRAWINGS
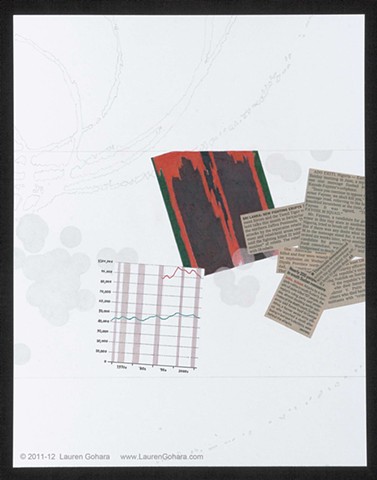
Do You Think You Can Tell #6R
Graphite, colored pencil, archival pigmented ink, deacidified newsprint on paper
14 x 11 inches
2012
Clusters of dots rendered in pale graphite float in from the right and cross the drawing. Over them is a graph of the change in median household income (green line) contrasted against the change in household income for households headed by a person with a bachelor's degree (red line). Vertical mute reddish-brown bars mark periods of recession. The jagged lines and red and green colors of the graph are echoed in the jagged edges in the reproduction of the Clyfford Still PH-827. News clippings of reports of deaths from political violence blot over the edge of the reproduction.
