DRAWINGS
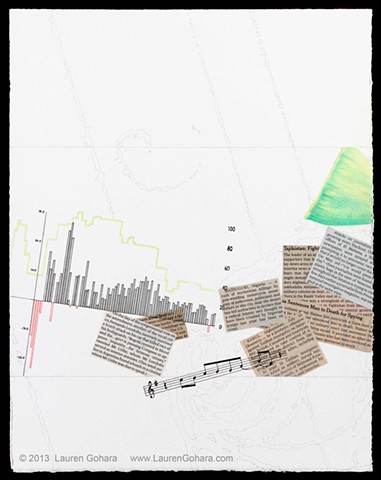
Do You Think You Can Tell #30
Graphite, colored pencil, archival pigmented ink, deacidified newsprint with Gudy870 adhesive on paper
14 x 11 inches
2013
News clippings of reports of deaths from political violence are scattered from left to right. A graph of the top individual income tax rate (green line) vs change in GDP (black & red bars) from 1930-2011 tilts down at left. A few bars of music straddle the bottom border. A pale green lotus seed pod nods in on the right edge while pale particle physics tracks arc through the background.
