DRAWINGS
Do You Think You Can Tell #46
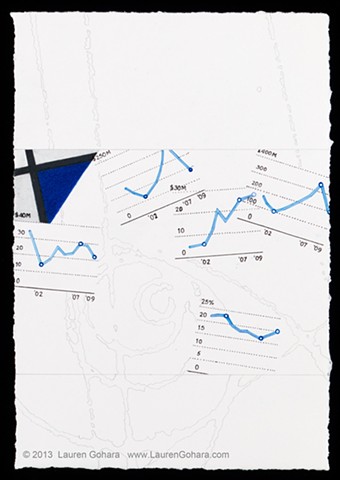
Graphite, colored pencil, archival pigmented ink on paper
8-11/16 x 6 inches
2013
The blue and black edge of Mondrian's "Tableau #IV" dominates one corner. Echoing the blue and black, are graphs depict income and tax data for the top 400 U.S. taxpayers from 2000 to 2009. Top, from L to R: average salary, net capital gains, dividend income, adjusted gross income; bottom: average tax rate paid. Particle physics tracks circle in the background.