DRAWINGS
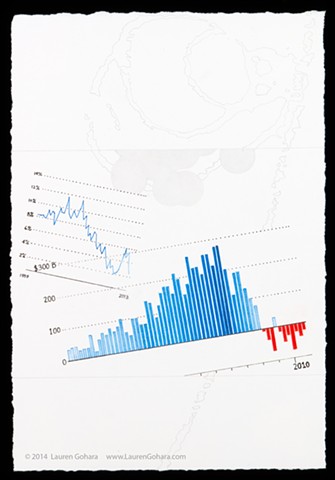
Do You Think You Can Tell #64
Graphite, colored pencil, archival pigmented ink on paper
8-5/8 x 5-7/8 inches
2014
A line graph in blue at left shows the gradual but persistent decline in the savings rate of Americans since 1959. In center, a red and blue bar graph illustrates the total dollar amount borrowed as home equity loans or lines of credit per quarter during the housing bubble through 2010. From 2004 through 2006, homeowners took out roughly $2.6 trillion dollars from their homes including via cash-out refinancings. As refinancings dried up in 2008, the end of the goosed-up spending made possible by the trillion-dollar stimulus has appeared as a drag on the economy. A handful of dots rendered in graphite appear at the top edge of the central horizontal section. Particle physics tracks curl through the background.