DRAWINGS
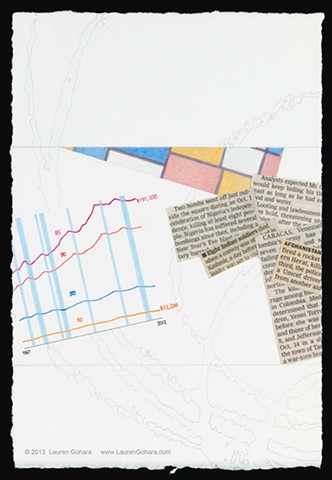
Do You Think You Can Tell #38
Graphite, colored pencil, archival pigmented ink, deacidified newsprint with Gudy870 adhesive on paper
8-1/2 x 5-3/4 in
2013
A graph of income stagnation among different income classes from 1967 to 2012 shows that while the four groups depicted have seen no growth in income over the past decade, those in 50th percentile or lower have seen relatively flat income for far longer. The found colors of the graph reflect those in a reproduction of a Mondrian painting that edges in from above. News clippings of reports of deaths from political violence echo the blocks of color in the geometric painting, though the content is far different.
