DRAWINGS
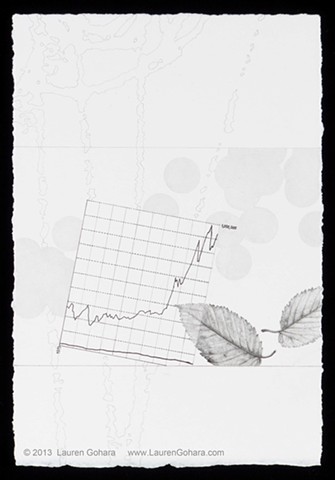
Do You Think You Can Tell #39
Graphite, archival pigmented ink on paper
8-1/2 x 5-3/4 inches
2013
A graph of the average income of the top 1% vs the bottom 99% in pen and ink tips over in the center of the drawing. Two American elm leaves waft through. Clusters of pale dots drawn in graphite hover behind, as the ghostly lines of particle physics tracks curve through the background.