DRAWINGS
Do You Think You Can Tell #59
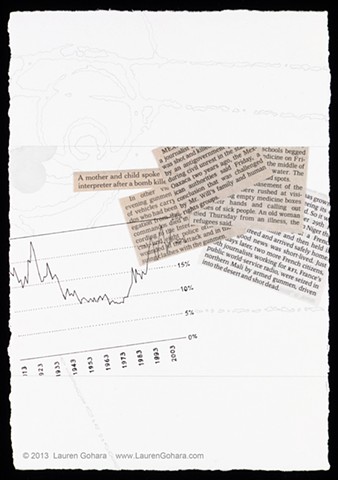
Graphite, archival pigmented ink, newspaper clippings with Gudy 870 adhesive on paper
8-5/8 x 5-7/8 inches
2013
A black-and-white graph shows the change in the top 1% percentage share of U.S. income from 1913 to 2012. A cluster of newspaper clippings report deaths from political violence. A few pale grey dots emerge at left, as particle physics tracks race through behind.